Plot room heat balance
This script:
Asks the user to open an IES-VE result file.
Plots the room heat balances for each room.
This was originally published as an article here: https://www.stevenfirth.com/how-to-plot-room-heat-balance-results-in-ies-using-python/
# PlotRoomHeatBalance
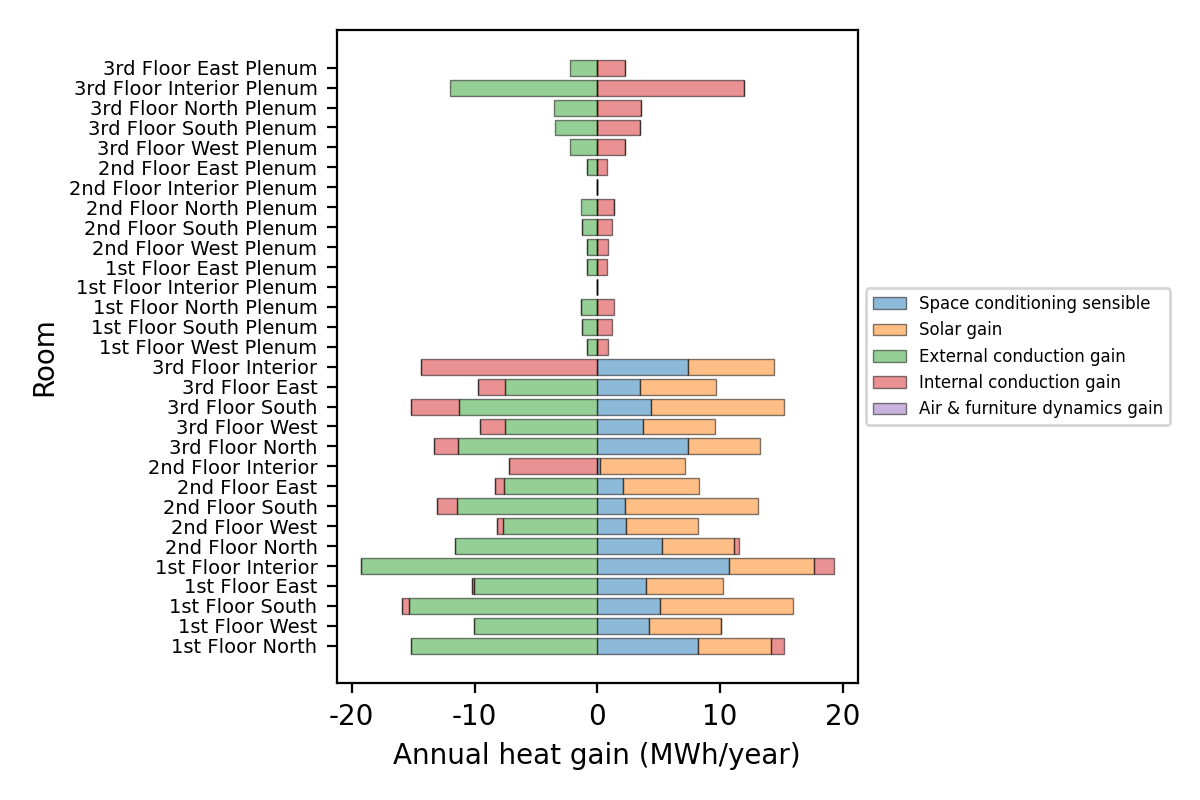
# - This script creates a plot of the (annual) heat gains and losses for all rooms in the building.
# - The heat gains and losses are plotted as a horizontal stacked bars for each room.
# 1. Setup
# - import packages
import iesve
import os
import math
from tkinter import Tk, messagebox
from tkinter.filedialog import askopenfilename
import matplotlib.pyplot as plt
import matplotlib.ticker
# - instances
current_project = iesve.VEProject.get_current_project()
# - directories
dir_current_project = current_project.path.replace('\\','/')
print('dir_current_project: ', dir_current_project)
if not os.path.exists(dir_current_project):
root = Tk()
root.withdraw()
messagebox.showinfo('Error', 'No IESVE project folder found.', parent = root)
root.destroy()
quit()
dir_vista = os.path.join(dir_current_project, 'vista')
# 2. Select results file
# - Select file
root = Tk()
root.withdraw()
fp_in = askopenfilename(title = 'Select IES results file', parent = root, initialdir = dir_vista, filetypes = [("APS files","*.aps")])
root.destroy()
print('fp_in: ', fp_in)
# - Exit if filepath is empty string
if fp_in == '':
root = Tk()
root.withdraw()
messagebox.showinfo('User input needed', 'Please select a .aps results file.', parent = root)
root.destroy()
quit()
# - Exit if filepath is not in project filepath
elif not dir_current_project in fp_in:
root = Tk()
root.withdraw()
messagebox.showinfo('User input needed', 'Please select a .aps results file in the current IES project.', parent = root)
root.destroy()
quit()
# 3. Get room data
# - a dictionary {room_id: room_general_data_dict}
realmodel = current_project.models[0]
bodies = realmodel.get_bodies(False) # False means get all bodies
room_data_dict = {body.id: body.get_room_data().get_general() for body in bodies}
# 4. Load gain data
# - a dictionary {variable_name: {room_id: annual_total_heat_gain}}
# - this selects only room variables which have 'units_type' as "Gain"
data = {}
with iesve.ResultsReader.open(fp_in) as f:
vars = f.get_variables()
for var in vars:
d = {}
if var['model_level'] == 'z' and var['units_type'] == 'Gain':
for room_id in list(room_data_dict):
x = f.get_room_results(room_id, var['aps_varname'], var['display_name'], 'z')
x = sum(x) if x is not None else 0
d[room_id] = x/1000000 # convert to MWh/year
data[var['display_name']] = d
#for k,v in data.items(): print(k, v)
# 5. Plot figure
#
height = (0.4 * len(room_data_dict))
if height < 2: height = 2
if height > 4: height = 4
#
#height = 6 / 1920 * 1080 # fixed aspect ratio for publishing figure
#
fig, ax = plt.subplots(
figsize = (
6,
height
),
dpi = 200
)
positive_lefts = [0] * len(room_data_dict)
negative_lefts = [0] * len(room_data_dict)
#
def plot_row(name, data, **kwargs):
""
for i, (room_id, height) in enumerate(data.items()):
if height > 0:
left = positive_lefts[i]
positive_lefts[i] += height
else:
left = negative_lefts[i]
negative_lefts[i] += height
line = ax.barh(
i,
height,
left = left,
label = name if i == 0 else None,
edgecolor = 'black',
linewidth = 0.5,
**kwargs)
return line
#
color_i = 0
for i, (k,v) in enumerate(data.items()):
for x in v.values():
if not math.isclose(x,0): # plot variable provided at least one annual total is non-zero
plot_row(
k,
v,
color = f'C{color_i}',
alpha = 0.5
)
color_i += 1
break
ax.legend(
loc='center left',
bbox_to_anchor=(1, 0.5),
fontsize=6
)
ax.set_xlabel('Annual heat gain (MWh/year)')
ax.get_xaxis().set_major_formatter(matplotlib.ticker.FuncFormatter(lambda x, p: format(int(x), ','))) # thousands separator
ax.set_xlim(min(negative_lefts) - (max(positive_lefts) - min(negative_lefts)) * 0.05, max(positive_lefts) + (max(positive_lefts) - min(negative_lefts)) * 0.05) # 5% margin on either side
ax.set_yticks(range(len(room_data_dict)))
ax.set_yticklabels([x['name'] for x in room_data_dict.values()])
ax.set_ylabel('Room')
ax.yaxis.set_tick_params(labelsize=10 - len(room_data_dict) * 3 / 30) # reduces room name font size based on nmber of rooms
fig.tight_layout()
plt.show()