Plot room air temperatures
This script:
Asks the user to open an IES-VE result file.
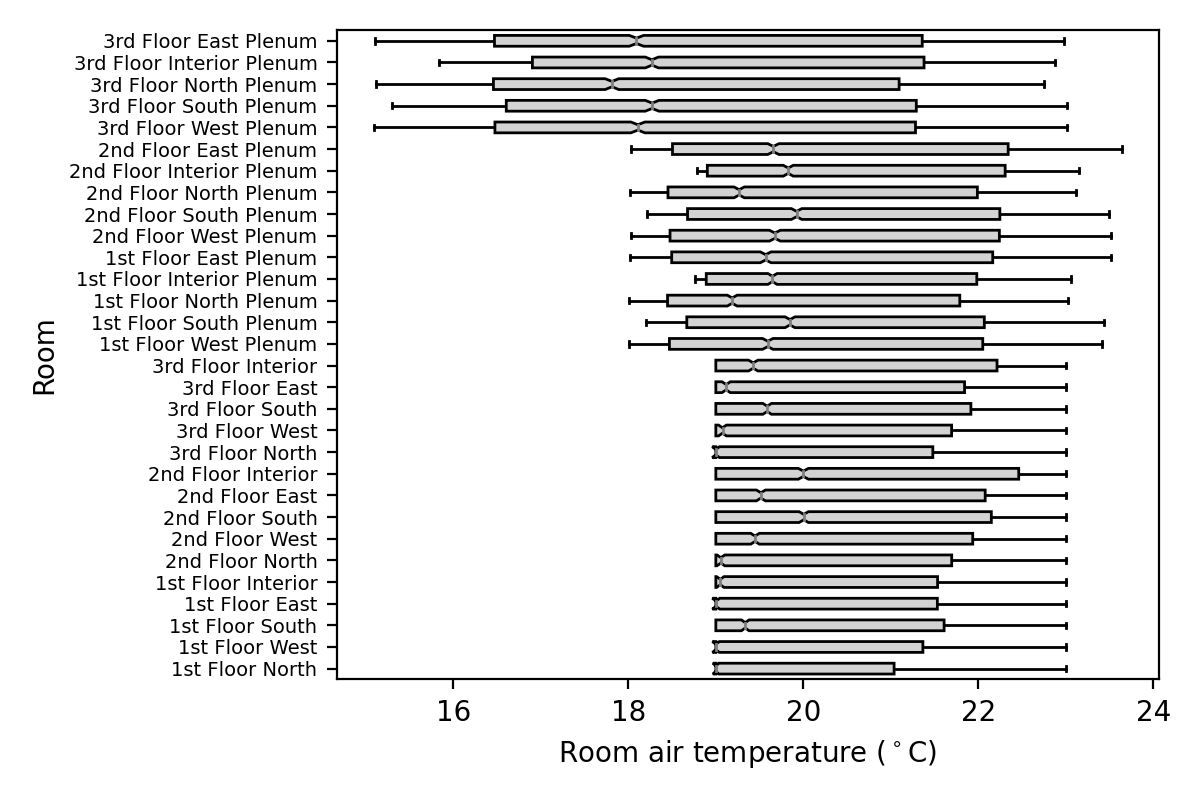
Plots the room air temperatures as a boxplot for each room.
This was originally published as an article here: https://www.stevenfirth.com/how-to-plot-temperature-results-in-ies-using-python/
# PlotAirTemperaturesBoxPlot

# - This script creates a plot of the (hourly) room air temperatures for all rooms in the building.
# - The temperatures are plotted as a boxplot for each room.

# 1. Setup

# - import packages
import iesve
import os
import csv
from tkinter import Tk, messagebox
from tkinter.filedialog import askopenfilename
import matplotlib.pyplot as plt

# - instances
current_project = iesve.VEProject.get_current_project()

# - directories
dir_current_project = current_project.path.replace('\\','/')
print('dir_current_project: ', dir_current_project)
if not os.path.exists(dir_current_project):
   root = Tk()
   root.withdraw()
   messagebox.showinfo('Error', 'No IESVE project folder found.', parent = root)
   root.destroy()
   quit()
dir_vista = os.path.join(dir_current_project, 'vista')

# 2. Select results file
# - Select file
root = Tk()
root.withdraw()
fp_in = askopenfilename(title = 'Select IES results file', parent = root, initialdir = dir_vista, filetypes = [("APS files","*.aps")])
root.destroy()
print('fp_in: ', fp_in)
# - Exit if filepath is empty string
if fp_in == '':
   root = Tk()
   root.withdraw()
   messagebox.showinfo('User input needed', 'Please select a .aps results file.', parent = root)
   root.destroy()
   quit()
# - Exit if filepath is not in project filepath
elif not dir_current_project in fp_in:
   root = Tk()
   root.withdraw()
   messagebox.showinfo('User input needed', 'Please select a .aps results file in the current IES project.', parent = root)
   root.destroy()
   quit()

# 3. Get room data
# - a dictionary {room_id: room_general_data_dict}
realmodel = current_project.models[0]
bodies = realmodel.get_bodies(False)  # False means get all bodies
room_data_dict = {body.id: body.get_room_data().get_general() for body in bodies}

# 4. Load temperature data
# - a dictionary {room_id: list of (hourly) temperatures}
with iesve.ResultsReader.open(fp_in) as f:
   air_temperatures_dict = {
      room_id: f.get_room_results(room_id, 'Room air temperature', 'Air temperature', 'z')
      for room_id in f.get_room_ids()
      }
air_temperatures_dict = {k:v for k,v in air_temperatures_dict.items() if not v is None}

# 5. Plot figure
fig, ax = plt.subplots(
   figsize = (
      6,
      min(0.4 * len(room_data_dict), 4)  # increase height of plot based on number of rooms
      ),
   dpi = 200
   )
ax.boxplot(
   air_temperatures_dict.values(),
   vert = False,
   notch = True,
   patch_artist = True,  # to enable box facecolor editing
   labels = [room_data_dict[x]['name'] for x in air_temperatures_dict.keys()],  # converts room ids to room names
   boxprops={'facecolor': 'lightgrey'},
   flierprops={'marker': '.', 'markersize': 1, 'markerfacecolor': 'grey', 'markeredgecolor': 'grey'},
   medianprops={'color': 'grey'}
   )
ax.set_ylabel('Room')
ax.set_xlabel('Room air temperature ($^\circ$C)')
ax.yaxis.set_tick_params(labelsize=10 - len(room_data_dict) * 3 / 30)    # reduces room name font size based on nmber of rooms
fig.tight_layout()
plt.show()